Data-driven analysis and decision making is even more important today in talent acquisition than it was just a few years ago. And understanding some of the most important benchmarks can help your talent team recognize how it stacks up compared to other enterprise organizations.
That is, how well they do advancing candidates through their recruiting funnel.
Below you’ll find benchmark numbers and conversion rates you can use to compare to your own talent acquisition efforts and improve your recruiting funnel health, efficiency, and performance.

Recruiting funnel benchmarks to know
1) Website visitor to applicant ratio: 34.6%
If your conversion rate is more than 35%, you are doing great; you probably have a well-known employer brand and a career site that attracts and engages visitors.
If your conversion rate is <34%, you are below the industry benchmark, so prioritize improving your employer brand and optimizing your career site with tailored content that will better convert visitors into applicants.
2) Average number of applications per job: 24.3
The tight labor market in the last few years has shown that it is challenging for employers to attract quality candidates — particularly active job seekers.
If your average number of applications per job is number is above 25, you are performing above the recruiting funnel benchmark of applicants per open role.
If your number is below 24, it doesn’t necessarily mean that you are doing something wrong. It could just mean that your roles are specialized and attract fewer applicants.
3) Application to interview ratio: 8.4%
The conversion rate from applicants to scheduled interview has decreased in recent years; for the last 12 months, the current application to interview ratio is down to 8.4%; this is down from around a high of 12% in the last decade.
4) Interview to offer ratio: 36.2%
This number has grown fairly significantly. While the interview to offer ratio had hovered between 16% and 19% during the last decade, this number has risen sharply to more than 36%.
This could mean more quality candidates are given opportunities for interviews or employers want to widen the field when it comes to candidates reaching the interview stage.
5) Offer to hire ratio: 55.6%
While this number had held steady in the 80% range for some time, the offer to hire ratio has gone down fairly sharply within the last few years. This means that about one in every two applicants accepts an offer they are given by an employer.

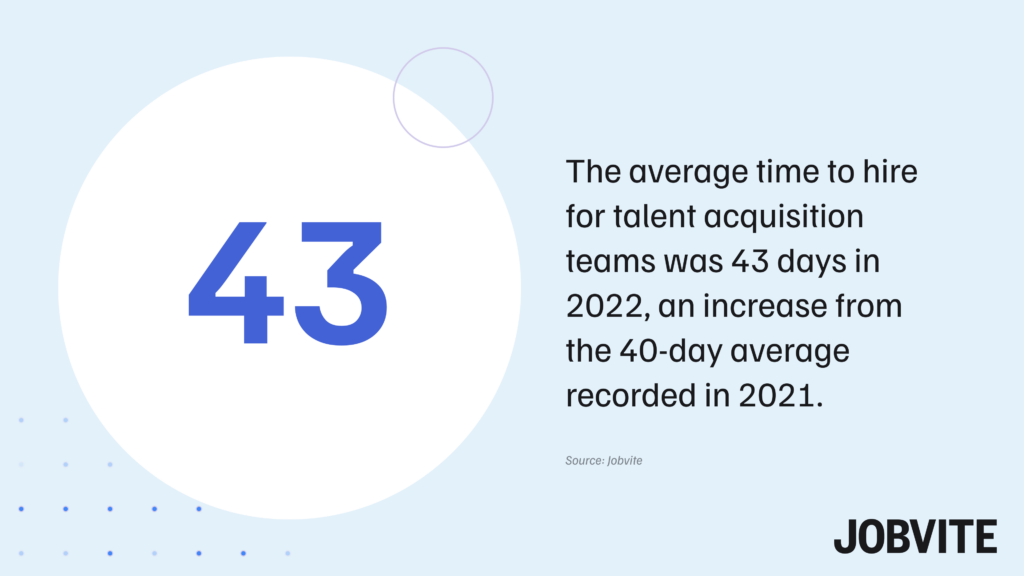
6) Time to hire: 43 Days
Time to hire for most organizations hovers around more than 40 days, and currently, it is sitting at 43 days as the latest benchmark. This means that within just over one month, companies are filling their open roles.
With hiring a game of speed, it is critical to determine areas where you can reduce the time to hire overall, including shortening feedback loops internally and moving candidates quickly through the hiring process.
7) Top sources by hire
Understanding where your top sources are coming from is also integral in knowing how to get more of your best talent. From a benchmark perspective, top sources of talent are coming from direct or private browsing, Indeed, company career site, and Google.
Spending time and resources to support candidates as they look for open jobs on these sources is paramount to staying competitive in finding top talent.
A Few Things to Keep In Mind
Remember, how you capture your company data depends on your processes. Make sure to have the right processes in place to ensure your data is consistent and usable for decision-making.
Also, remember to track the data that means the most to your business. And finally, remember the difference between must-have data and nice-to-have data.
It is essential to identify which data can help your talent acquisition function optimize performance.
View more industry data and recruiting benchmarks in our Employ Quarterly Insights Report and follow our blog to stay up-to-date on the latest talent acquisition insights.


